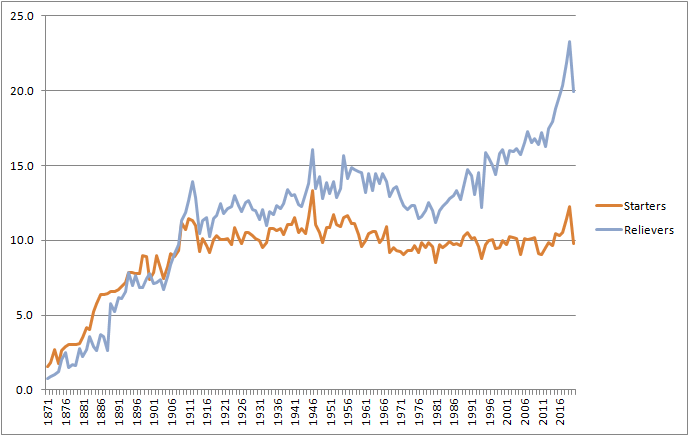
Just was thinking about the pen and how many were used there this year and the injuries so I thought 'how has this changed over the years'?

Oliver Drake set the record for most teams pitched on in 2018 with 5 teams including the Jays (1 2/3 IP over 2 games) - started with Milwaukee, purchased by Cleveland, taken off waivers by the Angels, off waivers by the Jays, off waivers by the Twins, post season waivers by the Rays, waivers by the Jays, purchased by Rays and still there now. Wow. Guy must have had no idea who he was pitching for day to day. Still only counts as one pitcher that season though.
All data via the Lahman database (http://www.seanlahman.com/)
Some basics to start...
- In 1871 MLB had only 115 hitters used, 19 pitchers (14 starters, 7 relievers)
- The lowest number of hitters used was in 1878 with just 77 hitters in the majors, and 1877 had just 92.
- The lowest number of pitchers used was in 1974 - only 17 total (14 started, 10 relieved)
- 14 starters is the lowest total (1871/74), 7 relievers the lowest (1871). Huh, 7 relievers is a normal game now isn't it?
- The lowest after 1900 (once the AL was formed) was 1904 with 364.1904 also was the lowest for pitchers at 129 (119/107 start/relief)
- Lowest in the Jays era (1977 on) was 1979 with 899 (34.6 per team).
- Most was 2019 with 1,410 (47 per team), 2012 was the last year with fewer hitters than the year before.
- 2020 was the first year to go down in # used since 2012, down to 1,289
For starting pitchers...
- In 1876, when the NL was formed, 23 starters for 8 teams = 2.9 per team.
- In 1893, when the mound went to 60'6" 86 starters used for 12 teams = 7.2 per team.
- In 1901, when the AL became a major league 125 starters for 16 teams = 7.8 per team.
- In 1919, when the HR record was under 30, 165 starters were used for 16 teams = 10.3 per team - more than I expected
- In 1992 when the Jays first won the World Series there were 264 starters used for 26 teams = 10.2 per team
- In 2008 when Cito tried to do a 1989 but fell short, 304 starters used = 10.1 per team
- In 2016 for the Jays 2nd straight playoff appearance 315 pitchers used = 10.5 per team (starting to climb)
- In 2018 the Rays start using openers - 343 starters used (a record at the time) = 11.4 per team
- In 2019 368 needed for 30 teams (a record) = 12.3 per team
- In 2020 294 used = 9.8 per team, but just 60 games played so kind of hard to use as a measuring stick of any kind.
Clearly for starters things have shifted. Underhand to overhand shifted from under 3 to 7-8, then it grew to just over 10 by 1919 when Ruth started mashing. It stayed there for decades, through the Jays WS years. but the last 5 years it has jumped again. Openers are the cause I'd say - shifting it as much as dead ball to live ball did.
For Relief pitchers....
- 1871: 7 relievers in all of MLB (9 teams) - under 1 per team. The Fort Wayne Kekiongas used just 1 pitcher all season (19 games).
- 1876: 20 used over 8 teams = 2.5 per team. 2 using just 2 pitchers total each (Hartford Dark Blues & St. Louis Brown Stockings)
- 1890: Early peak set with 131 relievers over 25 teams = 5.2 per team
- 1901: AL begins, 114 used over 16 teams = 7.1 per team
- 1919: Just as Ruth starts to mash 186 used over 16 teams = 11.6 per team.
- 1988: Eck closing for TLR to great effect, use of LOOGY's becoming common 330 used over 26 teams = 12.7 per team, less of an increase than I expected
- 2007: new record, first time over 500 relievers used - 518 over 30 teams = 17.3 per team (OK, getting nuts)
- 2017: crack 600 used for first time - 610 over 30 teams = 20.3 per team (getting silly)
- 2019: almost cracked 700 - 698 used over 30 teams = 23.3 per team (new rules put in)
- 2020: 599 used = 19.97 per team - 60 game schedule makes it impossible to really compare.

Looking at this I'd call Tony LaRussa the greatest villain in MLB history for pushing the pen to its limits in the 80's/90's. But boy there was a killer spike there in the 10's. 2013 set the record at 17.5 relievers used, broken in 2014, broken again in 2015 and so on through 2019. Way past time for tighter rules. Starters had a blip but that blip matches one post WWII, however relievers are growing and growing out of control. The 3 batter minimum I suspect is just the start. Might need to limit bullpen sizes (as already planned) and increase time guys must stay down if demoted among other items.
Oliver Drake set the record for most teams pitched on in 2018 with 5 teams including the Jays (1 2/3 IP over 2 games) - started with Milwaukee, purchased by Cleveland, taken off waivers by the Angels, off waivers by the Jays, off waivers by the Twins, post season waivers by the Rays, waivers by the Jays, purchased by Rays and still there now. Wow. Guy must have had no idea who he was pitching for day to day. Still only counts as one pitcher that season though.


