Batter's Box Interactive Magazine Batter's Box Interactive Magazine Batter's Box Interactive Magazine
Consider this a tack-on to Magpie’s excellent work from last week regarding the how the Blue Jays were historical in terms of their actual record vs. their Pythagorean record. It’s been postulated that part of the reason for this was that they scored a lot of meaningless runs, running up the score in games that were already out of reach. Another popular theory is that Toronto’s long-sequence-low-power offence was more prone to producing very small or very large run totals in any given game. This idea may be fueled (wrongly, in my opinion) by J.P. Ricciardi’s remarks near the end of the season about needing more hitters who could put the ball in the seats.

Anyhow, let’s see how the Blue Jay attack lines up against others that produced a similar number of runs over the season, in terms of number of runs scored in each game. “SD” is the standard deviation from the team’s overall runs per game average. “0-1” is the number of times they scored 0 runs or 1 run; and so forth. “Average” is for these 5 teams only, not all of MLB.

     	HR	R/G	SD	0-1	2-3	4-5	6-7	8+
LA of A	147	4.70	2.99	21	45	42	29	25
Atlanta	184	4.75	2.86	19	37	54	25	27
Oakland	155	4.77	3.45	28	39	37	25	33
Toronto	136	4.78	3.12	21	41	38	32	30
Cleve.	207	4.88	3.22	22	38	41	29	32
Average	166	4.78	3.13	22	40	42	28	29

So, despite hitting the fewest homers of the teams closest to them in terms of total runs scored, the Jays were dead average in terms of highs and lows (as demonstrated by the standard deviation). I’ll leave it to someone with better statistical chops to determine if it’s possible to get a better handle on this by looking at all Major League teams; I would expect that higher-scoring offences would inherently have higher standard deviations, and lower-scoring ones less standard deviation. I’m also guessing that part of the reason Atlanta has the lowest SD in this group is the more common use of one-run strategies in the National League.

Let’s look at this data in graph form:
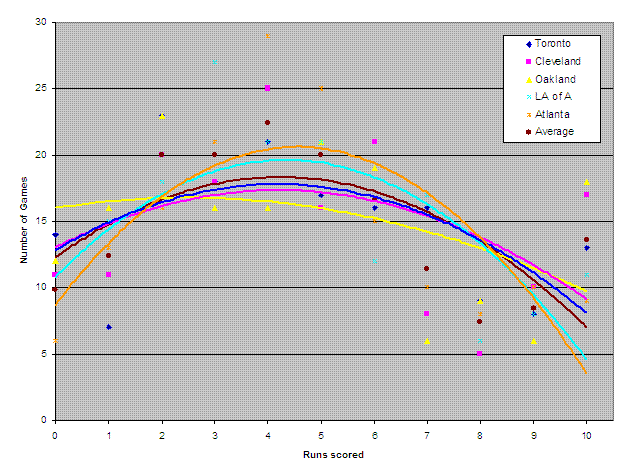
That’s a bit of a visual onslaught… Two points of clarification: The lines are 2nd-order polynomial trend lines fit to the data. “10” is actually “10 or more” runs scored. What I find interesting here is how very similar the Toronto and Cleveland offences look, despite Cleveland having launched 70 more home runs, and that Toronto is the closest to the average.

That's all I got. Any more-educated takes on what the data here tells us? On what it doesn't tell us?

Fables of the Run Production | 13 comments | Create New Account
The following comments are owned by whomever posted them. This site is not responsible for what they say.
Andrew K - Monday, November 28 2005 @ 11:29 AM EST (#133456) #
I don't think those quadratic fit lines are likely to be very helpful. According to this article: http://arxiv.org/abs/math.ST/0509698
the runs-scored-per-game follow a Weibull distribution. The paper is rather cute, because from the Weibull distribution the Pythagorean win-loss formula (with generalised exponent) follows.

I have no spare time at the moment to follow up what this means, but at the least I think you should be drawing best-fit Weibull lines.
Sister - Monday, November 28 2005 @ 11:30 AM EST (#133457) #
One take would be that among teams that score a similar amount of runs, homeruns seem to be not terribly important, and that JP should be more concerned about obtaining players with a better overall offensive production (RC, VORP or however defined)than focusing on players who hit "more balls into the seats" as their main redeeming quality.

Mike Green - Monday, November 28 2005 @ 12:45 PM EST (#133470) #
I missed the title reference the first time through. It was Monday morning, what can I say.

Anyways, I'm Green with envy.
MatO - Monday, November 28 2005 @ 01:14 PM EST (#133474) #
Could the title be also: "Run Production of the Fables"?

Or have I got the wrong reference?
Jonny German - Monday, November 28 2005 @ 01:41 PM EST (#133487) #
And here I thought you were always Green, envious or not...

Yes, MatO, you've got the right reference for this Document.
MatO - Monday, November 28 2005 @ 02:12 PM EST (#133496) #
Fables of the Run Production of the Fables.
Jim - Monday, November 28 2005 @ 07:08 PM EST (#133540) #
That Ryan better be a Monster.
R Billie - Monday, November 28 2005 @ 09:19 PM EST (#133555) #
I think the bigger question rather than looking at just the run distribution is whether the Jays can again score the same number of runs with the unfavourable peripheral stats they had. I read someone mentioning that they finished 25th in EQA in 2005 which I haven't verified but if true is a much bigger concern.

Because in that case it COULD mean that they overachieved in run scoring overall rather than being unlucky in run distribution (which it appears they weren't). So this actually makes me more worried about a possible backslide.
Ron - Monday, November 28 2005 @ 10:45 PM EST (#133564) #
Interesting numbers.

Usually when I see the words Standard Deviation I like to run away and hide. I still have nightmares from my Psych 300 class when I was in College.

Leigh - Tuesday, November 29 2005 @ 07:54 AM EST (#133576) #
it COULD mean that they overachieved in run scoring overall

You are quite right. After factoring in the elements of runs scored, and strength of schedule, the Jays' record slips right back to 80-82 (BP's "third order wins" based on "adjusted equivalent runs* [for and against]).

*Equivalent runs being the basis for EqA, which you mention.

subculture - Tuesday, November 29 2005 @ 01:15 PM EST (#133638) #
That sounds right to me.... Watching this team all year, it seemed like their batting (while 'scrappy') benefited from facing weaker than usual pitching (particulary in their division). On the other hand, the pitching faced scary bats most of the time, and was even better than the stats indicated.

Just a guess, but I would think the division's pitching could only get better this year, while the offence would likely remain just as tough.
rtcaino - Tuesday, November 29 2005 @ 02:15 PM EST (#133647) #
I think that adding a siolid middle of the line up hitter would be great. Giles with his career 950 or so OPS would fit nicley. Depending on what moves are made, we will certainly have a very dfeep line up. Our 6-8 should be more potent than the average team's.

Interestingly enough, though we finished 15th in EQA, the WS champs finished 24th.
subculture - Tuesday, November 29 2005 @ 03:02 PM EST (#133654) #
Agreed... we need at least one big bopper (Superman) in there. Though our 6-8 might be above average, our 1-4 is below average...

If we can keep our depth (which was huge last year) while improving at a couple of positions, the lineup will be much more effective. It can be done, it's not like trying to put a Man on the Moon.

This post is dedicated to the One I Love.
Fables of the Run Production | 13 comments | Create New Account
The following comments are owned by whomever posted them. This site is not responsible for what they say.