Jose Bautista, who is only the greatest RH slugger in franchise history, is hitting .181/.287/.324 against left-handed pitchers this season.
That can't be right. Or at least, it can't be normal. While he's hitting a not-too-wonderful .220/.331/.406 against RH pitchers, you would expect that with a normal platoon split against the sinister fellows he'd at least be.... well, let's just say more useful than he's been this year.
What the hell is going on? Has he developed some weird blind spot, and he's not picking up the ball out of a left-hander's hand as well?
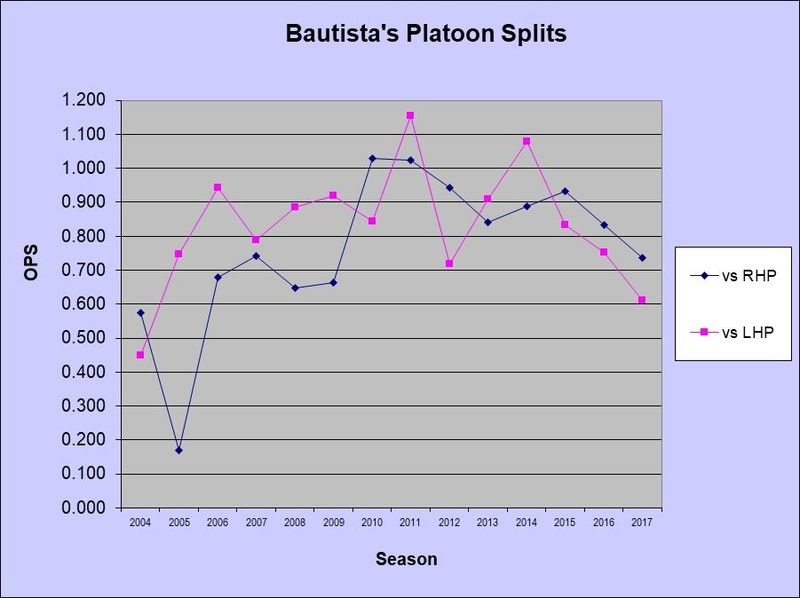
Anyway, I went back and looked at his career platoon splits. Partially in the Unending Quest for knowledge, and partially to see if I still knew how to make Data Tables (oh, you never forget that) or, even better, a pretty picture to illustrate what I've learned.
Here's the Data Table:
    Split         G    AB     R    H    2B   3B   HR   RBI   SB   CS   BB   SO    BAVG    OBP    SLG     OPS

2004    vs LHP    24   53     2    11    1    0    0     0    0    0    1   24    .208    .222   .226     .449
2005    vs LHP     6   11     1     3    1    0    0     1    0    0    2    2    .273    .385   .364     .748
2006    vs LHP    51  113    23    32    4    2    7    15    0    1   16   29    .283    .404   .540     .944
2007    vs LHP    56  121    23    31    8    0    4    14    3    1   21   21    .256    .366   .421     .788
2008    vs LHP    60  108    19    27    5    0    9    18    0    1   16   27    .250    .339   .546     .885
2009    vs LHP    64  123    17    36    8    2    6    18    1    0   19   21    .293    .382   .537     .919
2010    vs LHP    51  108    18    24    7    0    8    17    1    1   17   24    .222    .333   .509     .843
2011    vs LHP    63  119    24    40    7    0   11    21    1    1   33   24    .336    .484   .672    1.156
2012    vs LHP    43   85    16    17    3    0    5    14    2    0   12   13    .200    .306   .412     .718
2013    vs LHP    44   92    24    23    6    0    7    20    4    0   17   12    .250    .366   .543     .910
2014    vs LHP    60  116    22    40    3    0   10    19    0    0   21   19    .345    .449   .629    1.079
2015    vs LHP    61  104    16    24    6    1    5    20    2    0   26   19    .231    .382   .452     .834
2016    vs LHP    42   91    15    20    4    0    5    12    1    1   14   16    .220    .324   .429     .752
2017    vs LHP    53  105    17    19    6    0    3     7    0    1   15   33    .181    .287   .324     .611
    Split          G   AB     R     H   2B   3B   HR   RBI   SB   CS   BB   SO    BAVG    OBP    SLG      OPS

2004    vs RHP    29   35     4     7    2    0    0     2    0    1    6   16    .200    .317   .257     .574
2005    vs RHP     9   17     2     1    0    0    0     0    1    0    1    5    .059    .111   .059     .170
2006    vs RHP   109  287    35    62   16    1    9    36    2    3   30   81    .216    .306   .373     .679
2007    vs RHP   135  411    52   104   28    2   11    49    3    2   47   80    .253    .331   .411     .742
2008    vs RHP   113  262    26    61   12    0    6    36    1    0   24   64    .233    .301   .347     .648
2009    vs RHP    91  213    37    43    5    1    7    22    3    0   37   64    .202    .331   .333     .664
2010    vs RHP   154  461    91   124   28    3   46   107    8    1   83   92    .269    .388   .642    1.030
2011    vs RHP   137  394    81   115   17    2   32    82    8    4   99   87    .292    .436   .589    1.025
2012    vs RHP    90  247    48    63   11    0   22    51    3    2   47   50    .255    .375   .567     .942
2013    vs RHP   112  360    58    94   18    0   21    53    3    2   52   72    .261    .356   .486     .842
2014    vs RHP   150  437    79   118   24    0   25    84    6    2   83   77    .270    .391   .497     .888
2015    vs RHP   148  439    92   112   23    2   35    94    6    2   84   87    .255    .376   .556     .932
2016    vs RHP   114  332    53    79   20    1   17    57    1    1   73   87    .238    .376   .458     .834
2017    vs RHP   116  355    59    78   15    0   17    47    6    2   56   96    .220    .331   .406     .737

https://www.battersbox.ca/article.php?story=20170823143012103