Home Field Advantage
Monday, April 23 2007 @ 07:00 AM EDT
Contributed by: Magpie
The St. Louis Cardinals moved into a shiny new ballpark last spring,
Busch Stadium Version 3.0, and promptly went and won the World Series.
This is nice: it means that both the newest park in the majors and the
oldest were christened in the very best way possible. As everyone who
reads the Box is very well aware,
the Red Sox won the World Series in 1912, the year Fenway Park first
opened its doors. As best as I can tell, the only other time this has
happened was in 1923, the year that the House that Ruth Built was
originally built. The Ruth was mighty, he did prevail. There have been
two seasons where we could possibly attach an asterisk. The Cardinals
won it all in 1967, which was their first full season in Busch Stadium
Mark II; however, they had actually started playing there in mid-season
1966. Likewise, the Pirates moved into Three Rivers Stadium in July
1970, and won the whole enchilada the following season.
The
Cardinals did seem to enjoy their new digs - they played .613 ball
(49-31) at home, which is the only reason they made it to the
post-season at all. Their road record was a singularly unimpressive
34-47 (.420). In other words, they were .193 better at home than on the
road, a figure I am calling the Home Field Advantage (HFA).
And
that, ladies and gentlemen, means that Busch Stadium III currently
provides the biggest HFA of any ball park we've seen in the last
hundred years.
It's only one year, and we must not take it seriously. All together now - small sample size.
And this is a subject where the sheer size of the samples can get quite
impressive. The Cards have played 80 games in their new home, while
their ancient rivals in Illinois have played more than 7000 games at
Wrigley Field. The Cardinals HFA of .193 would be phenomenal if it held
up over the years, which it absolutely will not do. And as a single
season mark, it's only the 194th best HFA of all time - meaning that it's been bettered 193 times in the 2136 seasons that
major league teams have played since 1901. It's still impressive, it makes
the top ten percent, but it's probably just a single
season fluke.
I started thinking about home-road splits when I
was writing about the Astros a few weeks ago. They spent many
years in one of the more unique parks in the majors. I was pretty sure
that they had a larger than normal home-road split, and a quick and
dirty look at the data seemed to confirm it. I already was pretty sure
that the biggest home-road split of all, in recent years anyway,
belonged to the Colorado Rockies, another team that plays in a unique
environment. That these teams, playing where they did, should have such
a wide divergence between their performance at home and their
performance on the road seemed logical and natural to me. As I noted
while looking at Houston's checkered past,
Two things
regularly happen to any team whose home park has an extreme impact on
the baseball that is played there. First, it seems to become very
difficult for management to accurately assess their own players'
strengths and weaknesses.... Second, if the team finds something that
works at home, it doesn't work on the road.
Well, we know
about Coors Field and the Astrodome - unique playing environments. What
about all the other parks, past and present? Where do we find the
biggest home-road splits? How strange were the places that produced
them? How might we possibly find out?
We find out after your
humble servant first enters the home and away Win-Loss records and Runs
Scored and Allowed data for every active major league franchise. That's
2312 lines of data, and yes, I am certifiable. I was working on it one night when Liam logged on
to his computer and we started sending instant messages back and forth.
I told him what I was doing and he wrote, over and over again, that I
had completely lost my mind. Granted, I have no life - but in fact I already had
a spreadsheet with the total Win-Loss and Runs Scored for each of those
seasons (prepared for my now annual look at the History of Pythagoras.)
So this was really just a matter of entering the Home field data, and
writing some formulae to derive the Road data.
I thought it
was important to have League Totals for two reasons: a) it establishes
the standard HFA, that individual parks can deviate from; b) it allows
me to Check My Work. This was the really tedious part, proofing the
whole thing - making sure all the league totals and major league totals
can be reconciled. That's when you discover that you gave the Pirates
three too many home losses in 1981, and transposed the Tigers runs
scored and allowed in 1949... oh, this part was not fun at all. Let us speak no more of it... But if, for
the purposes of this study, I confine myself to the period beginning in
1901, the Runs Scored and Allowed should balance. And they did. Eventually.
My Big Whopping Spreadsheet only includes the 30
currently active franchises - while it includes what teams like Cubs
and Reds did in the 19th century, it doesn't include all of their
opponents, some of whom are no longer with us. Including the multiple
entries, there are 92 ballparks in this study; only five of them were
in use before 1901. In those cases, the figures given for the park
do include nineteenth-century games, against sometimes vanished
opponents; however, the National League totals given here are from 1901
onward.
Once we have all these numbers we can simply note when
each team started playing at a particular ball park... but then we run
into another issue. Teams have been known to change their home stadium in mid-season,
possibly for the sole purpose of causing me grief. In recent years, the
Mariners moved in mid-1999; the Blue Jays moved in mid-1989. Then there
are the teams that deliberately call two stadiums home. The Expos of
2003-2004, playing 22 games a year in San Juan, are the most recent
instance. The most striking instance of this is the Cleveland Indians
of the 1930s and 1940s, who played in Municipal Stadium ("the
Mistake by the Lake") only on Sundays and holidays, and at League Park
the rest of the time.
And it turns out that here we find the limit to exactly how much digging I am willing to do!
It
would, of course, be possible to go through the Retrosheet game logs
for 1999 and figure out which games were played at the Kingdome and
which at Safeco, how many runs were scored and allowed in the two
parks, and what the Mariners two home records would be. But...there are
at least 30 seasons that this would be required for. Life, especially
at my age, seems far too short.
So, by imperial fiat, I am assigning the season to the
park a team called home when the year began. For the Blue Jays, 1989
took place at Exhibition Stadium. That home run Canseco hit against
Flanagan? Sailed right over the grandstand at the old Ex. Don't you
remember? Why, I can see it now....
Anyway, that's why my figure for Crosley Field has 4564 games played there, while Chuck Foertmeyer's authoritative Crosley Field site reports that the total number of games played there was actually 4543.
Enough of these preliminaries... let's get to some Big Questions.
First things first. How often does the Home Team, anyway?
In
baseball, the home teams wins, on average, 54% of the time. To my
slight surprise, this figure has remained more or less constant for a
century now. When I was simply doing the data entry, it was my
subjective impression that the splits were bigger back in the early
days of the twentieth century. But here, decade by decade, is the
winning percentage of the home team in the two leagues:
Decade          AL      NL
1901-1910     .569     .534
1911-1920     .538     .536
1921-1930     .545     .548
1931-1940     .549     .549
1941-1950     .552     .541
1951-1960     .535     .544
1961-1970     .540     .540
1971-1980     .535     .541
1981-1990     .545     .536
1991-2000     .529     .542
2001-2006     .545     .536
ALL TIME      .542     .540
We can even make a graphic of this!
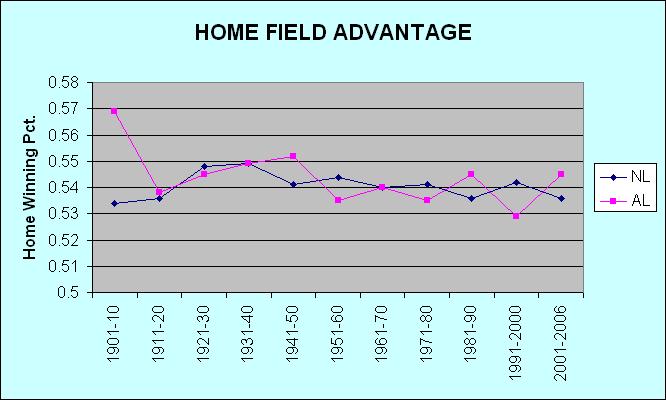
If the league is playing .540 ball at home, it means they're playing .460 ball on the road - which means that the average HFA should be about .080. And finally, some sort of standard begins to emerge from the mist!
So what was the largest single season HFA ever?
Let me introduce you to the 1945 Philadelphia A's, who played at an unremarkable .527 clip (39-35) in
their own digs at Shibe Park. But away from home, they were an utterly horrific 13-63 (.171) - I checked and double-checked, believe me! -
giving them an HFA of .356. The second best HFA ever was also posted by the
A's, way back in 1902 in long vanished and forgotten Columbia Park. That year's team was mediocre on the road, going
27-36 (.429). But at home they were simply awesome:
56-17 (.767).
The worst HFA ever? Glad you asked, it wasn't that
long ago. In the Year of the Strike, 1994, the Cubs went 20-39 (.339)
at Wrigley Field. Just the Cubs being Cubs? Maybe, but away from home
they played .537 ball (29-25), giving them an HFA of -.198; well, it
was a strike year. I was thinking that maybe they ending up playing all
their scheduled home games against the Braves, but the strike wiped out
a trip into Atlanta. Or something like that. But no, that's not what happened. The Braves, Expos, and
Mets did all came to Wrigley Field once and each time the Cubs got
swept, while the Cubs were going 5-3 visiting those teams. But the big
deal was Colorado - the Cubs took 5 of 6 at Mile High, but lost 5 of 6
to the Rockies at Wrigley.
Three teams have played .800 ball at home since 1901,
and two of them posted more impressive HFAs than the 2006 Cardinals,
although all of these teams were pretty good on the road as well. The
best home record ever was posted by the 1932 Yankees (62-15, .805). They
were pretty good away from home (45-32, .584) but it's still an HFA of
.221 And the famous Yankees of 1961 played .802 ball (65-16) at the
Stadium and a decent .543 (44-37) on the road, for an HFA of .259. The
third team that played .800 ball at home also played .600 ball on the
road - the mighty Philadelphia A's of 1931 (60-15 at home, 47-30 on the
road.)
However. These are all single season results, and a
single season is simply much, much, much too small a data set. Those 1932 Yankees, with
the best home record ever and an HFA of .221? Just three seasons later,
they would play .640 ball on the road, and .554 at home, posting a negative HFA of -.086.
Anyway, what I'm interested in are what these effects are like over time. And the Big Table, in the Data Table companion to this piece, tells us the tale: it takes every park in action over the last century and ranks them by HFA.
Which brings us to our following Top 16 - the parks that have provided the greatest Home Field Advantages in history. I'm insisting on a minimum of 800 games played to qualify. While some very interesting parks don't meet that standard, I'll have a peek at a few of them as well. I was thinking of posting a Top 10, but I had to go sixteen deep just to
get ten parks who hadn't shut their doors by 1920. And you'll also notice
that twelve of these sixteen are at least seventy-five years old.
So - the Top 16! Would you care to guess which park has provided the biggest home field advantage?
1. Coors Field (Denver, 1995-current) HFA .169
- We're all familiar with this place and what makes it special. I'm
just here to confirm that the Rockies of the last decade have the
biggest home-road split in history (using our 800 game minimum.) In
this case, it's not the park that is unique so much as the environment.
Denver is 1600 metres above sea level, and it makes a considerable
difference. Coors Field and Mile High Stadium are, by far, the best
hitting hitting environments in the history of the game, in a class all
their own. It makes me wonder how far the ball would carry from the top
of Mount Everest (five times as high.) The air is thin, and it's also true that gravity itself is weakened, as we move further
and further away from the planet's core.
2. Bennett Park (Detroit, 1901-1911) HFA .134
- It was built in 1896, and the Tigers played there from 1901 through
1911, when it was demolished and replaced by Tiger Stadium (home plate
at Tiger Stadium was in Bennett Park's left field corner.) I have no
information about its dimensions - I do know that left-handed batters
were looking into the afternoon sun as they stood in the box. Didn't
seem to bother Cobb and Crawford too much, but perhaps they got used to
it. It was a tiny place, holding barely 5000 people. Structures were
erected outside the ballpark so that people could peer in. Admission
was charged, much to the dismay of Frank Navin and the Tigers.
3. South End Grounds III (Boston, 1895-1914) HFA .130
- Alas, there's little I can tell you about this one. The second South
End Grounds was destroyed by fire in May 1894, and this version took
its place two months later. The Braves (Beaneaters, actually!) of the
1890s were the greatest of all nineteenth-century teams, and they
kicked some serious butt at home - in 1897-98 they went 116-27 in their
own park. We do know that the dimensions were weird - very short down
the lines (250 feet in LF, 255 feet in RF) and very deep to centre and
the alleys (more than 440 feet.) So it sounds as if it may have
resembled the Polo Grounds. In 1914, with the Braves in a pennant race,
they moved across town to shiny new Fenway Park (bigger capacity) and
played there until Braves Field was ready for them in August 1915.
4. Astrodome (Houston, 1965-1999) HFA .123 -
A park of quite recent vintage, and familiar to everyone, it was also a
park of considerable historical interest. It was the first dome, and it was the
first time baseball was played on artificial turf. It was always a
notoriously tough place to hit. While its dimensions down the lines and
to straightaway centre were more or less the same as everywhere else,
the power alleys were very deep. Most significantly, though, the ball
simply did not seem to carry very well. I think it's also possible that
the visibility may not have been optimal.
5. Polo Grounds III (New York, 1891-1911) HFA .121 -
New York teams played baseball in four different parks known as the
Polo Grounds. Only the first one, just north of Central Park, was ever
actually used for polo. The Giants were evicted from the original one
and moved uptown to the southern parcel of Coogan's Hollow in 1889.
While the new park was officially known as Manhattan Field, it was
called New Polo Grounds from the beginning. Our incarnation, Polo
Grounds III, was built by the Players League on the northern part of
the Hollow for the 1890 season. The Giants moved in after that league
collapsed. The Giants played here from 1891 until it burned down in
April 1911. A replacement with temporary stands was constructed on the
spot for the 1911 season, and rebuilt with concrete for the 1912
season, giving us Polo Grounds IV. We have lots of information of the
final version of the Polo Grounds. Even though it was demolished some
forty years ago, most baseball fans are aware of its bathtub shape and
its weird dimensions. Its predecessor probably resembled it fairly
closely. Both versions played as decent pitcher's parks - while it was
laughably short down the lines, the centre field fence was almost out
of sight and the foul territory was enormous. Here's the 1905 version.

6. Dolphins Stadium (Miami, 1993-current) HFA .117
- Like Coors, what makes Dolphins Stadium a strange place to play is
not so much the park itself as the place. South Florida is one of the more humid
parts of North America, and afternoons here especially are hot and muggy. Baseballs do
not travel all that well through humid air. It's also, first and
foremost, a football stadium (it's not directly named after the aquatic
mammal). The dimensions are a little long down the lines and in the
power alleys.
7. Fenway Park (Boston, 1912-current) HFA .108 - Ah,
the Fens. The quirks of Fenway Park have been celebrated in story and song
for a long time, and they are indeed numerous. The foul territory is
very small; the outfield wall follows a strange zig-zagging path from
the right field corner to the left, with odd nooks and crannies along
the way. The famous 37 foot wall in left turns routine fly outs into
line drives ricocheting around the outfield.
It was not always
thus. The changes to Fenway over the years have been numerous, if for
the most part incremental. Fenway was actually a pitcher's park for
most of its first two decades - in their first 21 seasons there, the
Red Sox scored and allowed more runs in their road games 14 times.
Overall, 14009 runs were scored in 1585 Boston road games, while 13375
runs were being scored in 1583 games at Fenway - so the park's
offensive impact was 0.9547 - comparable to Turner Field or today's Yankee
Stadium.
The Sox were a bad team for most of this period. They
won the World Series three times during their first decade at Fenway.
However, also during that period, twice they sold off one of the
greatest players ever to play the game - Tris Speaker and Babe Ruth.
Once might have been daring, but twice was definitely tempting fate,
and the Red Sox ran off 15 consecutive sub-.500 seasons after that
third title. Overall, from the time Fenway opened in 1912 through the
1932 season, the Red Sox played .507 ball (802-781) at home, and .409
(648-937) on the road. That's an HFA of .098, which is certainly
significant.
Both tendencies began to change in the 1930s. The
immediate reason is fairly easy to see. Major renovations took place in
the 1933-34 off-season after fire destroyed the grandstand and the
original left field wall after the 1933 season. The wall in left had
been 25 feet high; 1934 was the first season of the Big Tin Monster, 37
feet high (they didn't paint it green until 1947.) Furthernore, the
outfield dimensions were adjusted in 1934, bringing straightaway centre
some 70 feet closer; Duffy's Ditch, the incline in left field, was more
or less eliminated at the same time. The impact was immediate: 1934 saw
the park have its most positive impact on offense ever (1.12), and 1935
was even better (1.17). A few years after that, in 1940, the bullpens
were moved from their original position, in the field of play along the
foul lines to the current enclosure in right field. This was probably
the most significant alteration in transforming Fenway into a hitter's
haven, and undoubtedly a move much appreciated by Ted Williams.
The
team got better, spurred this time (at first, anyway) by the cash
purchase of stars from other teams (Joe Cronin, Jimmie Foxx, and Lefty
Grove.) During this second phase of Fenway history, from 1933 through
1964, the Red Sox appear to have derived an enormous boost from their
ball park. They were a .523 team overall during this thirty-two year
period. In the Fens, however, they played at a .597 clip (1470-994); on
the road, they were but a .450 team (1111-1360). The HFA
during these years, then, was .147, and that's one of the highest
figures as we've seen in the history of the game - and all the
ballparks that have seen higher HFAs, including Coors Field, posted
their numbers in far fewer games. The Red Sox played more than 2400
games at Fenway during these years - none of the parks with HFAs higher
than .147 had as many as 1000 games played there. This period also
marks the highest point of Fenway's history as a hiter's park. The Red
Sox scored and allowed 24950 runs in 2464 games at Fenway, while
scoring and allowing 22323 in 2471 road games. That places the park's
Offensive Impact at 1.1177 during this period.
In the last
forty-two seasons, the Red Sox HFA has been sliding towards the league
average. For this period as a whole, the Sox HFA has been slightly
above the average at .085 (1926-1415 .577 at home, 1637-1692 .492 on
the road.) But while the overall figure for this period is near the
league average, as a practical matter it's been declining - (see Table
below.) The Sox have played .534 ball during this period, the best
overall mark of these three periods, largely because they've seldom
played better away from home.
Fenway's overall impact on offense
has remained high, although a bit short of the 1933-64 level. For this
third period, the Offensive Impact has been 1.1146, as the Sox have
scored and allowed 32797 runs in 3341 games at Fenway, while scoring
and allowing 29426 runs in 3329 road games. While not quite what it had
been, it means that Fenway was still a better hitter's park than
Ameriquest, which on the overall numbers ranks as the best hitter's
park in the AL.. Fenway's overall figures don't match Ameriquest solely
because of its twenty year run as a pitcher's park more than seventy
years ago.
However, Fenway's Offensive Impact does not match
that of Ameriquest in the thirteen seasons that the two parks have
both been in the AL. During this period, the Fens has given a modest
boost to run scoring (10697 runs in 1027 home games, 10106 in 1013 road
games, an Offensive Impact of 1.0584). It's just another hitter's park
now, nothing particularly special. The change is generally attributed
to new press box, built in 1988, which appears to have affected the
wind currents at Fenway. Of even more interest during this period is
that the Red Sox HFA has actually fallen below the league average -
they've played .578 ball at home during these last few years and .522
on the road, an HFA of just .056. That last fact further hints at how
the Sox home-field advantage has been declining, and I think it's time
to produce another pretty picture so that you might see for yourself:
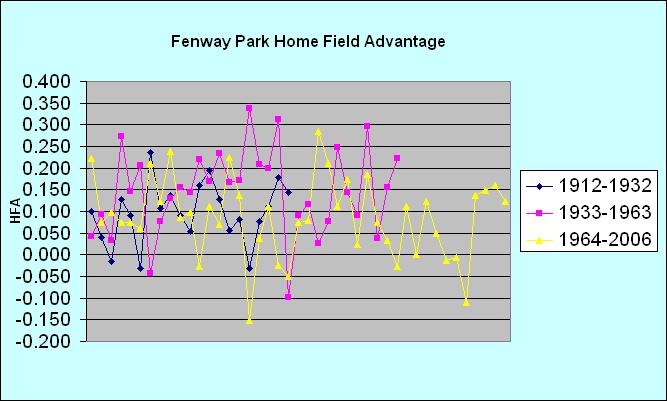
I
think the trend might actually be visible, although that yellow line
has come bouncing up off the mat these last four seasons, hasn't it?
8. League Park II/ Cleveland Municpal Stadium (1934-1946) HFA .106 -
This is actually a two-park platoon - both parks were at one time or another the exclusive home of the Indians, but they found their biggest HFA when they were splitting games between the two of them. During these years, the Indians were playing most of their games at League Park II - they used cavernous Municipal Stadium
for Sunday games and holidays. Cleveland teams were actually playing at
League Park back in 1891 - they had a National League team back in
those days. These were the famous Cleveland Spiders, who today are only
remembered for their 20-134 record in 1899. The Spiders had actually
been a very good team before that last disastrous season, and why not -
their pitching staff was anchored by a fellow named Cy Young, who
actually pitched the first game played at League Park back in 1891. The
new AL Indians took up residence here in 1901. After 1909, the place
was extensively renovated - it was essentially transformed from an
old-fashioned wooden park into a modern steel and concrete structure.
9. Ameriquest (Texas, 1994-current) HFA .104
- At the moment, this is the best hitter's park in the American League.
It's probably the heat, not the humidity - the average daily
temperature from June through September exceeds 30 degrees - the
ballpark is also constructed below ground level to keep it out of the
summer winds
10. Crosley Field (Cincinnati, 1912-1970) HFA .104 -
The Cincinnati Reds played at the corner of Findlay and Western from
1874 to 1970. The original wooden park, National League Park, was
replaced in 1902 by one of the first concrete and steel stadiums,
portentously named the Palace of the Fans, with its elaborate facade
and Corinthian columns. The designers forgot to include dugouts or
clubhouses for the players, however, and its capacity was just 6,000
people. It fell into disrepair with alarming speed and Crosley Field,
originally known as Redland Field, was built on the same site in the
winter of 1911-12. The new park was perhaps most notable for its cozy
dimensions: the wall in centre-field ran in a straight line between the
two power alleys, bringing dead centre field no further than 390 feet
from home plate (it has long been believed that it may have been
considerably closer), while also reducing the distance in the alleys.
The reduced outfield area would have made it possible for the Reds to
get by without particularly quick outfielders while playing at home.
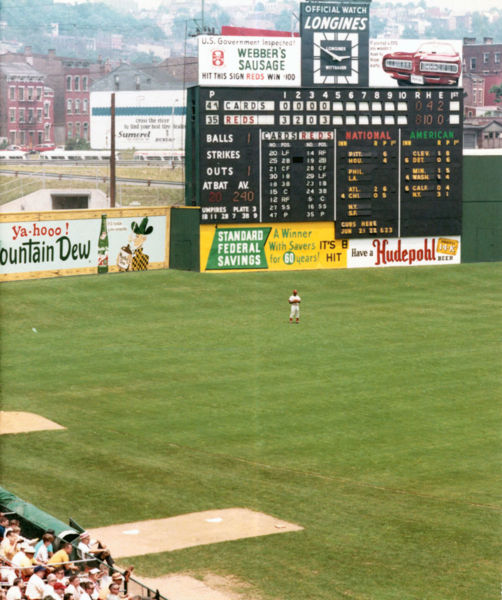
The other most memorable feature was the terrace in left field - like
Fenway, the park was several feet below sea level, and like Duffy's
Ditch, this slope remained to demonstrate the descent.
11. Washington Park III (Brooklyn, 1889-1911) HFA .102 - Brooklyn played here from 1989 until Ebbets Field was ready in 1912.
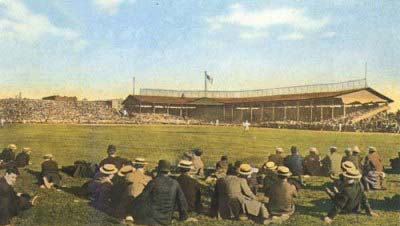
I'm not aware of any distinguishing features, beyond the foul smell wafting up from the nearby Gowanus Canal. Perhaps that was enough to put the opposition off their game.
12. Robison Field (St. Louis, 1893-1920) HFA .099 -
The place the Cardinals played was also known as New Sportsmans Park,
League Park, and Cardinals Park, and is perhaps most noteworthy as the
last wooden park used in the major leagues. The Cardinals played here
until mid-1920, when they joined the Browns at
Sportsmans Park (later known as Busch Stadium), where their AL rivals had been settled in since 1902. The old place, Robison Field, was
severely assymetrical when play first began there - 290 feet down the
RF line and 470 feet to left,
with the left-centre alley at least 525 feet from home plate. The
fences were moved in 1909, which eased this effect somewhat, but it was
still 320 feet down the RF line and 380 feet in left.
13. Veterans Stadium (Philadelphia, 1971-2003) HFA .097 -
Three similar parks joined the National League in 1970-71: Riverfront
Stadium in Cincinnati, Three Rivers Stadium in Pittsburgh, and the Vet
in Philadelphia. They are remembered as the cookie-cutter facilities,
all spacious, symmetyrical artificial turf parks, with little in the
way of history and personality. With the Astrodome and Bush Stadium II
already in place, and Olympic Stadium coming along a few years later,
they made the NL into the turf league. The cookie cutters may not have
been quite as identical as they seemed - it certainly agreed with the
Phillies much more than their previous digs at Connie Mack Stadium.
(Whereas both the Reds and Pirates had more impressive HFAs at their
old parks, Crosley Field and Forbes Field.)
14. Exposition Park (Pittsburgh, 1882-1909) HFA .097 - The home of the Pirates before Forbes Field. I have learned practically nothing about it, which is a shame. It was one of the two parks that hosted the first World Series, and this was where Honus Wagner played in his prime. Wagner! It may have been very, very long down the foul lines, but not particularly deep to dead centre (450 feet was not all that deep in the first decade of the century - some parks went over 500 feet.) Not that there was a lot of home run hitting to discourage. In fact, it now seems clear to me that one of the things that made Babe Ruth and the home run explosion that began in the 1920s possible was the emergence in 1910-1915 of the new generation of concrete baseball stadiums. Gone, for the most part, were the 450 foot power alleys. Ruth was the first player to take advantage of the new circumstances, but if he'd been born twenty years earlier, it wouldn't have mattered very much how far he hit the ball. It was probably going to stay in the yard no matter what.
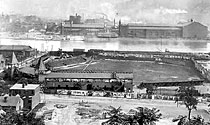
15. Metrodome (Minnesota, 1982-2006) HFA .097 -
They still play in the HubieDome, one of the few artificial turf parks
left in the game. Roger Clemens once said that playing baseball here
was like playing marbles in a bathtub. I think we all have a sense of
how much this park helped the Twins from the 1987 and 1991 World
Series. Both years, the Twins lost all six World Series games played in
the NL park, but won all eight games played at the Metrodome. Opposing
teams have accused the Twins of manipulating the air conditioning
during games, and when the place is full the fans make an incredible
racket.
16. Yankee Stadium (New York, 1923-1973) HFA .096 - There's knowing something and then there's knowing
it. The original Yankee Stadium,
before the renovations in the 1970s, was a much more unusual park than
the one the Bombers call home these days, and the Yankees of Ruth and
DiMaggio had a bigger home field advantage than the Yankees of
Mattingly and Jeter. I have always known that Yankee Stadium was a pitcher's park, and
before the renovations in the 1970s, it was an even more hostile
environment for hitters. But I didn't realize that it depressed offense
almost as much as Dodger Stadium or the Astrodome. The old Stadium was an extreme pitcher's park, one of the toughest places to score runs in the history of the game.
I already had a
healthy appreciation of the greatness of Ruth and Gehrig and DiMaggio
and Mantle - it just went up.
****************************************************************
Random Notes on some other parks of some interest:
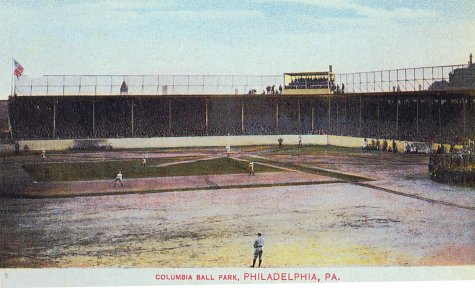
Columbia Park
(Philadelphia AL, 1901-1908) - The Philadelphia A's played here for their first eight seasons and
evidently derived a big boost from it - they were a losing team on the
road, but they played .671 ball when they came home. It's the biggest
home-road split on record, even more profound than Coors. This place
has been gone for 99 years and it's almost impossible to know what was
special about it. It appears to have been a good place to hit (Off.
Factor of 1.0632), and the A's did lead the AL in home runs in five of
the eight seasons they played there. Of course, this was when a team
could lead the league in homers by hitting 30 of them. It was built on
a rectangular lot, so it may have been yet another of those old parks
that were short down the lines and very deep in centre. Shoeless Joe
Jackson made his major league debut here, on August 25 1908.
Baker Bowl (Philadelphia NL, 1904-1938) -
Until they started playing a baseball a mile above sea level, the Baker
Bowl in Philadelphia was the greatest hitter's park in the history of
the game. You're wondering why? Look carefully at the outfield
configuration, and pay particular attention to the right-field area.
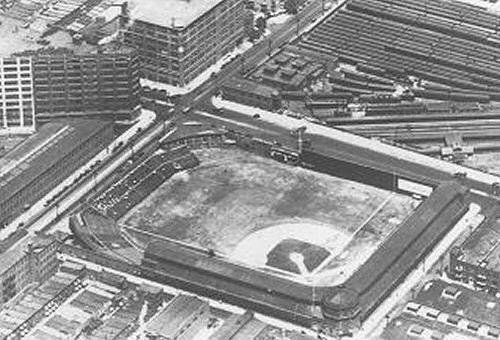
Does
that look just a little close? It's not only that it was 270 feet down
the line in right - the power alley in right-centre was a mere 300 feet
from home plate. This was the home park of the game's only true power
hitter before Babe Ruth. Gavvy Cravath, you'll recall, was a right-handed
hitter. While the wall was close in right field, at
its original size (40 feet), it was bigger than the Green Monster, and
then they made it bigger still (60 feet high.) A weird place to play
ball.
US Cellular (Chicago AL, 1991-current) - We're all familiar with Comiskey II,
and generally think it to be one of the better home run parks in
baseball. Which is why the single most surprising piece of information
that turned up in all of this number crunching was this - the White Sox
have scored and allowed fewer runs at home than on the road
since they moved here in 1990. That's right, US Cellular has been a
pitcher's park. Not by a huge margin, not like Dodgers Stadium or
anything like that. Its overall impact on offense has been similar to
Jacobs Field, or Busch Stadium II. Offense is reduced a little bit.
Sportsmans Park II (St. Louis AL 1902-1953, St. Louis NL, 1921-1966)
- This was a good park for the Cardinals (HFA of .089) and even
better for the Browns (HFA of .095). Both teams spent more than forty seasons playing
here, and roughly 30 of them overlap (the Browns were here first, the
Cardinals remained for another 12 years after the Browns moved to
Baltimore.)
Candlestick Park (San Francisco 1960-1999) - It's the unique
features of parks that give the home team an edge, and the most unique
thing about the Stick was the weather. Candlestick Point in the evening
is chilly and windy, and happens to be in one of the parts of San
Francisco where the fog rolls in regularly. And the wind - everyone has
heard about the gust of wind that blew Stu Miller right off the
pitcher's mound during the 1961 All-Star Game; a few years later, a
gust of wind hoisted the batting cage off the ground and dropped
it 60 feet away, on the pitcher's mound. It regularly blew in from left
field, but both Willie Mays and Orlando Cepeda proved to be
right-handed hitters who were quite capable of hitting with power to
the opposite field, and taking advantage of the jetstream blowing out
to right. Something Willie McCovey took advantage of naturally.
Forbes Field (Pittsburgh 1910-1970)
- The Pirates played here for more than 60 seasons, meaning that both
Honus Wagner and Roberto Clemente called it home. While it was the site
of one of the most famous home runs in baseball history (Mazeroski's
World Series winning walkoff in 1960), it is odd that never, in the
park's long history, did it host a no-hitter. (Bob Gibson tossed one at
Three Rivers within that park's first year.) It was assymetrical and
odd - the amount of real estate in the outfield, especially when it
first opened, was roughly equivalent to that of a National Park, like Yosemite or Yellowstone. The dimensions were adjusted in the
1920s, bringing the right field line from 360 feet to 300 - however,
the left field line stayed roughly 360 feet for all 60 years. Centre
field was always at least 430 feet, and both alleys were over 400 feet
as well. A team could not hope to compete here without speedy
outfielders (this was where Owen Wilson hit his 36 triples in 1912),
and unfortunately two of the Pirates greatest players while they were
here were outfielders who didn't run all that well - Ralph Kiner and
Willie Stargell. But it was a strange park, with unique requirements,
and such parks generally tend to work to the home team's advantage.
Most of the time, anyway.
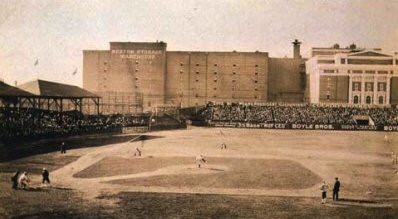
Huntington Avenue Grounds (Boston AL, 1901-1911) - The
site of the first World Series game, and also the place where Cy Young
pitched the first perfect game of the 20th century, this place had a
number of odd features. For one thing, the outfield area was huge - the deepest
part of centre field was more than 600 feet from home plate. There
were patches of sand in the outfield where grass simply would not grow.
Most quaint of all, there was a toolshed in deep centre field, and it was in play.
Petco Park (San Diego 2004- current) - There are only three seasons in the book, but on the data we have so far, Petco Park is the worst place to hit...ever. So far, this has been the best pitcher's park in history, with run scoring
at just 83% of what happens in Padres road games. Greg Maddux and David
Wells have made a wise, wise choice for their twilight years.
The second part of this piece, appearing right below this one, for the most part provides all the raw numbers that this little account is based on. And while we're there, we crunch the numbers to look at each park's impact on offense.
11 comments
https://www.battersbox.ca/article.php?story=20070331142356304


