THere is another installment in what will surely turn out be a multi-part series: let's think of it as a Post-Mortem Analysis of the 2005 Blue Jays.
One of the things I intend to do is produce full season versions of many of the Data Tables I threw together on the fly at various points during the season. This one is about the bats.
We all anticipated trouble with the bats. The Blue Jays scored just 719 runs in 2004, and then watched and wept as the greatest hitter in franchise history left town as a free agent. The Blue Jays Roundtable Preview prophesied trouble ahead. To wit:
Dave Till: They'll have trouble scoring enough runs.
Jordan: The offence just won't be there.
Gerry: I am concerned about the offense, will it score enough?
Magpie: 79-83. Sorry, they just won't score quite enough runs.
I thought it possible, however, that the Blue Jays could reduce their runs allowed - 823 in 2004 - by about 60. Just giving all of Pat Hentgen's innings to Roy Halladay ought to do the trick. In fact, in a giddy fit of optimism called And I Have a Dream Today, I actually wrote:
if everything breaks right, the Jays can cut their runs allowed into the 730-750 range. An enormous IF, I grant you. A dream, perhaps.
If this happened, and the offense stayed at the same 2004 level of 4.45 runs per game, the Jays would probably win 78-80 games. To get beyond that and into actual contention for a post-season berth would require roughly a 100 run improvement from the offense. So my bright idea was this: How about if every spot in the lineup, plus the bench, is 10 runs better than last year. Is that feasible?
What do I know? It just seemed so remote that the Jays could actually reduce their runs allowed by 70 to 90. And they didn't. Despite Roy Halladay making just 19 starts, the 2005 cut their runs allowed by 118, from 823 to 705. The only appropriate response to that is "Wow."
Did they get the 100 more runs scored that I thought they would need? No - they scored 56 more runs in 2005. Granted, with the totally unforeseen improvement in the run prevention department, this actually should have been enough to propel them at least into the 86 win range. And we'll be talking some more over the winter about just how it came to pass that the Jays scored 70 more runs than they gave up, and still lost more games than they won.
But this is about the bats. I was hoping that the chance of squeezing an extra 10 runs of offense from each position was - well, not exactly impossible. So how did it all shake out? Here comes the Data Table: AL offensive production by lineup position, sorted, as always when I do the heavy lifting, by Runs Created per Game.
There is a sensible objection, by the way, to this sort of analysis. Nobody goes to bat as a defensive player - everybody is just a hitter. By the standards of AL first baseman, Eric Hinske is not one of the best hitters around. Even I, the Dude's Advocate, will not quarrel with that assessment. However, Hinske really is one of the better hitters available to the Toronto Blue Jays - I will brook no argument on this issue - so you'd better get him in the lineup if you can.
However, while looking at production by defensive position may be irrelevant at the game level, it is surely relevant at the roster-building level. Most of the available bats tend to cluster at the far end of the defensive spectrum. If you're having trouble scoring runs because you have a black hole soaking up at bats in the middle infield - that's a hard problem to solve. But if you're getting lousy production from your DH or first baseman, that's good news by comparison. It's an easier hole to fill.
Anyway, the Raw Numbers. Scoring was down in the AL this year, from just over 5 runs per game in 2004 to about 4.75. Normally, offense increases as the weather warms up. This was happening in 2005, when in August, for no apparent reason, league-wide offense suddenly began plungin towards April levels, and reached them in September.
Just for entertainment value, I'll include as well the full-season version of some pretty pictures I made in mid-season. These broke down the offensive performance of the Jays regular hitters into 10 day segments. The purpose at the time was to try to get a handle on who was streaky, who was slump-prone, who was consistent.
CATCHERS
TEAM	    AB   R   H  TB 2B 3B HR RBI  BB  SO SB CS SH SF HBP GDP  AVG  SLG  OBP  RC RC/27
Minnesota  582  72 182 252 38  1 10  81  58  80 13  1  2  3   4  19 .313 .433 .376  90 6.09
Cleveland  613  78 179 276 37  0 20  86  70  86  0  1  1  8   5  17 .292 .450 .364  95 5.91
Boston	   597  84 157 277 37  1 27  82  72 165  4  0  1  3   6  11 .263 .464 .346  93 5.69
Texas	   575  69 147 243 33  0 21  76  33  88  0  0  7  3   7  10 .256 .423 .299  70 4.44
Baltimore  578  66 150 252 25  1 25  76  26 113  0  1  2  4  11  23 .260 .436 .301  67 4.23
AVERAGE	   585  69 151 231 29  1 16  72  45 101  3  2  3  4   7  17 .258 .395 .315  67 4.20
New York   578  75 137 226 26  0 21  78  65 114  0  0  2  5   3  12 .237 .391 .314  68 4.16
Chicago    601  79 153 247 29  0 22  67  30  90  0  4  3  1  13  18 .255 .411 .302  67 4.03
LA Angels  580  58 149 230 18  0 21  86  36  85  2  2  9  3   3  18 .257 .397 .298  63 3.96
Detroit	   631  86 161 255 33  5 17  68  22 115  7  3  3  9   8  24 .255 .404 .284  65 3.71
Oakland	   654  76 175 212 32  1  1  61  54  56  8  3  0  5  20  26 .268 .324 .340  66 3.70
Toronto	   551  72 129 187 23  1 11  67  78 100  2  3  4  5   2  15 .234 .339 .327  58 3.68
KC         565  58 136 214 30  3 14  70  35 120  3  2  2  3   3  14 .241 .379 .286  57 3.57
Tampa Bay  558  42 145 197 28  0  8  57  30  81  0  1  3  7   6  21 .260 .353 .300  53 3.48
Seattle	   525  54 113 164 21  0 10  46  24 124  1  3  8  2   3  14 .215 .312 .249  37 2.44
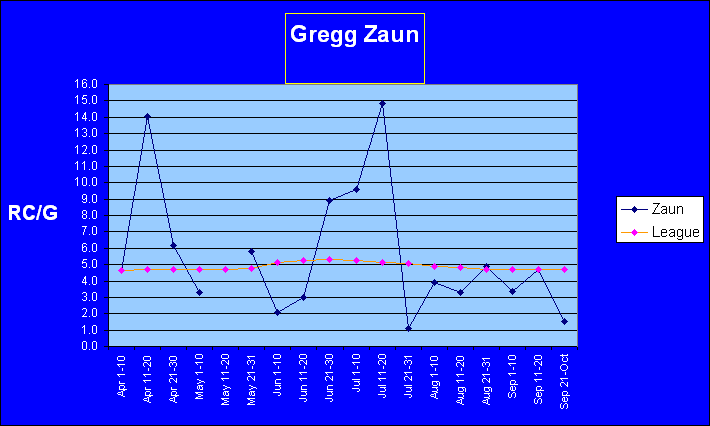
The young guns are taking over - Joe Mauer and Victor Martinez are emerging as the class of the league. I thought the Jays would see some improvement in 2005 simply because they wouldn't be giving some 180 at bats to Kevin Cash. The prospect of Ken Huckaby never even occurred to me. Gregg Zaun was very close to being a League Average offensive player this season (4.8 RC/G); this meant that he was a considerably better hiter than the average AL catcher. Unfortunately, the other Toronto catchers hit .183 in 126 at bats, which dragged the team's production well below the league average. And the chart demonstrates, graphically (!), what happened to Zaun's offense as the season went on. The lack of a practical alternative gave the skipper little choice but to play Zaun until he dropped. Or at least stopped hitting.
FIRST BASE
TEAM	    AB   R   H  TB 2B 3B HR RBI  BB  SO SB CS SH SF HBP GDP AVG  SLG  OBP  RC RC/27
Texas	   643 110 191 359 39  3 41 136  74 126  4  0  0  3  11  16 .297 .558 .378 129 7.71
New York   568  95 156 305 23  0 42 118  96 122  2  0  0  5  13  15 .275 .537 .389 113 7.42
Seattle	   592  99 158 318 38  1 40 123  89 169  1  1  0  3   6  16 .267 .537 .367 110 6.81
Chicago    606  92 163 295 21  0 37  94  78 125  0  1  0  3   5  10 .269 .487 .355 101 6.14
Baltimore  577  78 169 254 23  1 20  80  65  63  3  1  6  9   3  14 .293 .440 .359  89 5.86
Boston	   598  74 167 261 29  1 21  92  69  88  0  0  0  6   8  18 .279 .436 .358  88 5.49
AVERAGE	   608  87 165 278 31  2 26  96  63 115  3  2  1  5   7  15 .271 .457 .343  90 5.49
Detroit	   624  87 167 288 31  3 28  84  58 158  0  1  0  3  11  17 .268 .462 .339  91 5.36
KC         621  72 177 256 39  1 13  87  44  99  3  0  5  8   5  16 .285 .412 .331  81 4.94
Toronto	   626  98 167 281 38  2 24  98  35 128  9  1  0  7  11  18 .267 .449 .314  83 4.86
Cleveland  609  80 156 283 33  5 28  95  38 128  4  3  1  5   6  14 .256 .465 .303  80 4.77
Oakland	   596  79 159 240 30  0 17  83  70  78  0  2  0  9   4  18 .267 .403 .343  77 4.74
Tampa Bay  580  80 146 241 28  2 21  78  64  99  9  8  0  1   3  13 .252 .416 .329  73 4.54
Minnesota  615  76 150 264 31  4 25  91  56 117  0  2  0  6   6  13 .244 .429 .310  77 4.48
LA Angels  663  92 180 249 32  3 11  79  52 113 10  3  4  3   1  10 .271 .376 .322  78 4.39
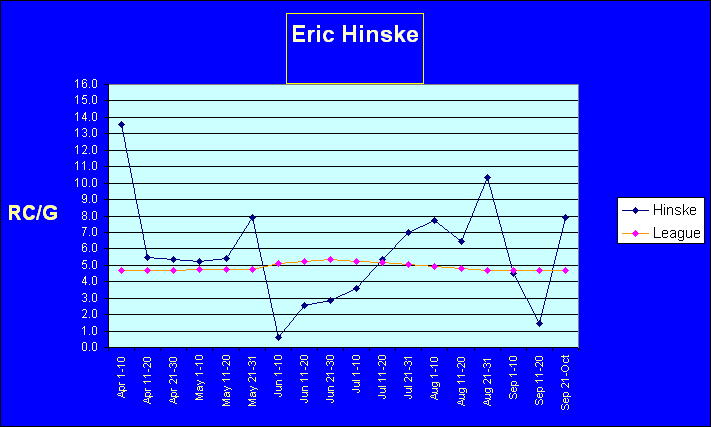
Oh, we all knew this was coming. Even though he was injured and having an off year, Delgado still gave Toronto the fourth best production in the league in 2004. The Jays split the 1B duties, by a ratio of roughly 58-42 per cent, between Hinske and Hillenbrand. Shea proved to be a much better hitter when he was playing 1B than when he was playing 3B. Hinske, on the other hand, was a much more effective hitter when he was DHing than when he was in the field. Hinske had a strange season - twice in the course of the year, his hitting just suddenly and completely fell right off a cliff. He just stopped hitting completely. The first time this happened, it took him several weeks to slowly regain his form. The second time, in September, he bounced right back immediately.
As for Delgado, he created more than 8 runs a game despite playing in a pitcher's park in a new league. He would have given Toronto the best production in the league at 1B, and been worth at least 30 additional runs. Sigh.
SECOND BASE
TEAM	    AB   R   H  TB 2B 3B HR RBI  BB  SO SB CS SH SF HBP GDP  AVG  SLG  OBP  RC RC/27
Baltimore  660 108 202 318 48  7 18  77  76  91 29 10  5  4   4  13 .306 .482 .377 117 6.89
Texas	   656 107 177 338 43  2 38 107  37 127 31  2  0  5   8   7 .270 .515 .314 108 6.07
Oakland	   608  94 174 266 26  6 18  74  60  77  1  4  4  4   5  14 .286 .438 .351  88 5.47
Detroit	   625  88 182 262 35  3 13  69  32  68  9  3 13  7  10  12 .291 .419 .326  84 5.14
LA Angels  566  73 166 216 31  2  5  56  39  94 29  5  5  8   7   8 .293 .382 .339  76 5.11
Chicago    627  87 174 262 29  7 15  75  56 136 20  6 14  6   7  16 .278 .418 .334  86 5.11
New York   640  89 189 289 40  4 14  68  23  87  3  6 12  3   5  19 .295 .452 .318  84 5.02
AVERAGE	   610  84 165 252 33  4 15  73  46 101 13  4  7  6   7  14 .271 .414 .323  79 4.78
Tampa Bay  602  80 156 258 29  2 23  94  37 120  2  1  7  6  12  18 .259 .429 .309  74 4.51
Boston	   571  92 145 226 36  3 13  63  68 143  7  4  2  6   3  15 .254 .396 .332  71 4.49
Toronto	   596  87 158 232 31  5 11  78  46  80  8  2  1 10   6  11 .265 .389 .319  72 4.46
Cleveland  620  75 166 258 39  1 17  81  37  85  6  2  8  6   4  21 .268 .416 .307  73 4.35
Minnesota  586  64 150 202 19  6  7  51  53 109 13  4 11  4   4  14 .256 .345 .315  62 3.85
Seattle	   611  64 143 218 38  5  9  69  34 101 15  4  4  4  10  15 .234 .357 .282  58 3.36
KC         566  66 133 189 21  4  9  55  44 100  4  8 11  8   6  10 .235 .334 .288  52 3.26
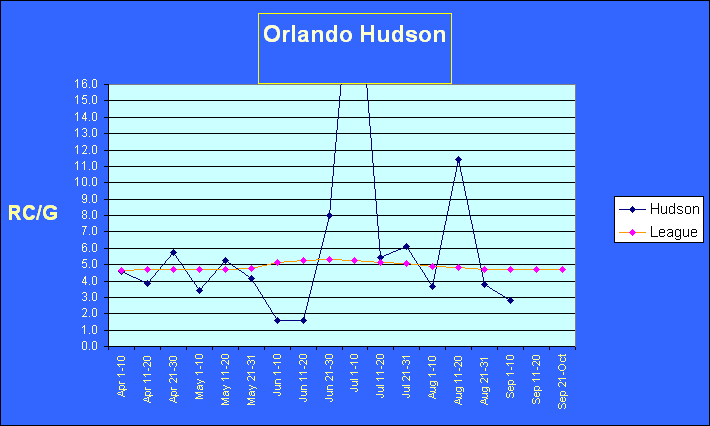
A bit of a step backward here, as Toronto actually had the third best offensive production in the AL out of this position in 2004. Once again, Orlando Hudson and Frank Menechino had most of the at bats. Hudson was solid, but not quite as good with the bat as in 2004. The same applies to Menechino, who actually hit well enough while he was playing 2b - it's just that little Frank had been sensational coming off the bench the year before. In Hudson's case, he didn't have the usual number of spikes in his performance, periods when he got red hot. A further problem was the work of Aaron Hill, who contributed an utterly empty .273 batting average - no walks and no ower - when he was filling in over the final month. The Jays production was down, and the bar had been raised around the league, by Brian Roberts in particular. Oakland and Detroit, in particular, made big upgrades.
THIRD BASE
TEAM	    AB    R   H  TB 2B 3B HR RBI  BB  SO SB CS SH SF HBP GDP  AVG  SLG  OBP  RC RC/27
New York   615	122 195 368 30  1 47 129  88 140 21  6  0  3  16   8 .317 .598 .414 150 9.66
Baltimore  648	 91 180 298 32  1 28  91  52 116  7  4  8  3  10  10 .278 .460 .336  97 5.61
Boston	   583   78 172 248 40  3 10  70  66  84  1  0  2  5   8  22 .295 .425 .370  85 5.59
Toronto	   620   91 175 261 34  2 16  79  65 108  6  2  0  2  12  15 .282 .421 .361  89 5.41
Oakland	   633   92 165 283 40  0 26 101  60 133  6  0  1  9   2  11 .261 .447 .322  89 5.15
Tampa Bay  595   81 168 261 38  2 17  79  38 109  2  1  4  5   7  17 .282 .439 .328  80 5.07
Detroit	   626   80 166 267 33 10 16  75  65 141  7  7  8  6   3  14 .265 .427 .331  84 4.91
AVERAGE	   610   82 163 261 33  3 20  80  54 117  8  4  3  4   7  16 .266 .427 .329  81 4.86
Texas      658   83 172 282 35  0 25  92  51 140  1  0  0  4   4  16 .261 .429 .317  84 4.65
Chicago	   575   69 149 248 24  3 23  71  33  79  9  8  2  4  10  11 .259 .431 .308  71 4.50
Seattle	   635   73 157 258 37  2 20  91  43 121  5  1  0  4   5  16 .247 .406 .298  72 4.06
LA Angels  610   89 150 237 29  8 14  58  53 132 25 11  6  3   2  11 .246 .389 .304  69 4.06
Minnesota  581   71 149 229 33  4 13  59  51 101  5 11  6  6   4  32 .256 .394 .315  59 3.69
KC         577   71 144 210 34  4  8  60  49 123 10  3  4  1   1  20 .250 .364 .307  59 3.68
Cleveland  585   63 134 201 20  1 15  64  40 116  9  4  6  6   9  17 .229 .344 .283  53 3.18
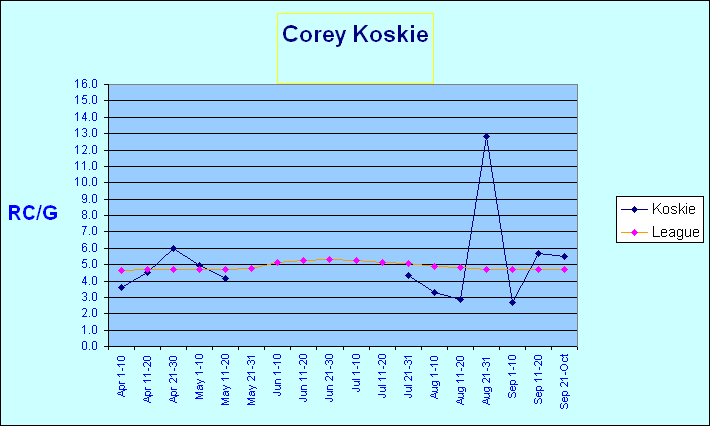
That Alex Rodriguez is one hell of a hitter. Well, we knew that already. What we may not have known, and which should come as a pleasant surprise, is the production Toronto got from their three-headed third baseman. Seriously, who expected Toronto to get more offense out of their third basemen than the teams that employ Eric Chavez, Hank Blalock, and Adrian Beltre? In 2004, thanks to Eric Hinske's poor season, they had ranked 13th in the league. Only half the 2005 at bats went to Corey Koskie, which was not exactly the plan, but it worked out anyway. Koskie hit much, much better (.270, .364, .426) when he was at 3b than when he was the DH. The rest of the playing time was divided between: Shea Hillenbrand, who was adequate, if not quite as good as Koskie when playing third; and Aaron Hill, who was playing here for those first few weeks when he hit the ground running, like the next coming of Paul Molitor.
SHORTSTOP
TEAM	    AB   R   H  TB 2B 3B HR RBI  BB  SO SB CS SH SF HBP GDP  AVG  SLG  OBP  RC RC/27
Texas	   682 115 223 347 42  5 24  95  56  93  5  2  0  3   3  22 .327 .509 .379 122 7.16
Baltimore  657  91 201 345 50  5 27  99  41  81  5  1  1  3   7  26 .306 .525 .351 110 6.48
Cleveland  596  90 172 298 39  6 25  84  63 139  1  3  2  5   4  13 .289 .500 .357 101 6.41
New York   676 120 205 297 25  5 19  71  80 122 13  5  8  3  12  16 .303 .439 .381 110 6.29
Tampa Bay  648  95 192 267 39  6  8  65  63  79 39 11  3  4   6   8 .296 .412 .360  97 5.76
Oakland    606 101 161 262 43  6 16  67  64  90  5  1  6  1   1  15 .266 .432 .333  83 5.04
AVERAGE	   621  85 171 255 34  5 14  69  50  94 12  4  6  4   6  14 .275 .412 .330  81 4.88
Boston     670 106 182 252 38  4  8  73  58 114  9  4  7  6   3  15 .272 .376 .327  79 4.39
LA Angels  632  76 168 237 35  5  8  69  45  56 26  2  4  2   3  14 .266 .375 .315  74 4.30
Toronto    593  76 147 212 31  5  8  72  62  71 16  2  7 10   6   7 .248 .358 .317  70 4.22
Seattle    555  59 147 204 33  6  4  48  37  88  8  7  5  4   7  12 .265 .368 .314  60 3.99
Chicago    550  65 135 212 23  3 16  74  37  87  9  6 12 10   4   8 .245 .385 .287  60 3.92
KC	   629  71 168 233 22  5 11  57  21 111  7  5 10  2  15  13 .267 .370 .301  67 3.91
Detroit	   619  67 157 223 28  7  8  39  38  89  9  3  3  0   3  15 .254 .360 .299  62 3.64
Minnesota  575  61 135 187 29  1  7  47  36  96 10  2 11  4   4   9 .235 .325 .278  52 3.20
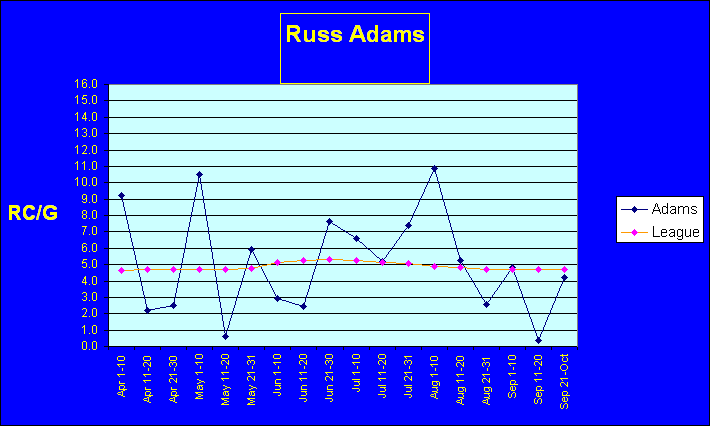
This was an upgrade as well - Toronto shortstops were awful in 2004, better than only Seattle's. It wasn't quite as significant an upgrade as many of us were expecting, mainly because Russ Adams appeared to crash into the Rookie Wall over the last six weeks of the season. You can see it pretty clearly in the graphic. The other shortstops were awful at the plate - John McDonald slapped some singles, but he slugged .321, and Aaron Hill didn't hit at all when he played here (.146 as a shortstop.) Derek Jeter ranks fourth despite yet another fine year, and despite Nomar and A-Rod no longer being around at the position in the AL. The new kids on the block are Michael Young and Jhonny Peralta.
LEFTFIELD
TEAM	    AB	 R   H  TB 2B 3B HR RBI  BB  SO SB CS SH SF HBP GDP  AVG  SLG  OBP  RC RC/27
Boston     625 123 179 354 35  1 46 153  84 134  1  0  0  9  10  22 .286 .566 .375 124 7.50
Texas	   629  95 169 324 41  6 34  89  61 109  5  2  0  3   5   7 .269 .515 .337 106 6.24
Detroit    627  81 189 316 31  3 30 106  32 109  3  1  1  4   5  15 .301 .504 .338 101 6.20
Cleveland  653  94 197 304 45  4 18  77  55  94 15  7 12  5   0  10 .302 .466 .348 104 6.16
Tampa Bay  681 109 205 319 33 15 17  84  28 106 43  7  6  7   5  12 .301 .468 .327 105 5.95
LA Angels  653  88 194 301 35  3 24 110  37  95  6  5  0  4   1  15 .297 .461 .364  93 5.50
Toronto    632  80 180 265 38  7 11  81  44  98  3  7  5  5  22  11 .285 .419 .347  88 5.23
AVERAGE    635  90 189 297 36  5 20  89  54 107 15  6  5  6   7  14 .278 .437 .332  93 5.20
NY Yankees 646 100 180 266 32  3 16  84  58  84 19  3  3  5   3  11 .279 .412 .337  89 5.15
Seattle	   618  84 164 244 37  2 13  70  64  94 14 11  7  4   8  11 .265 .395 .337  78 4.67
Oakland	   594  79 147 244 36  2 19  75  52  82  3  4  2  4  11  11 .247 .411 .317  73 4.42
Minnesota  674  82 186 262 35  4 11  69  44  90  9  7  5  6   9  16 .276 .389 .324  80 4.41
KC         613  81 169 243 25  5 13  68  42  90  5  4  2  6   5  21 .276 .396 .323  71 4.34
Chicago    647  96 174 212 30  1  2  38  56  98 58 23  9  7   5   9 .269 .328 .325  70 4.01
Baltimore  598  73 143 228 26  4 17  60  42 114  8  2  7  4   2  11 .239 .381 .286  63 3.76
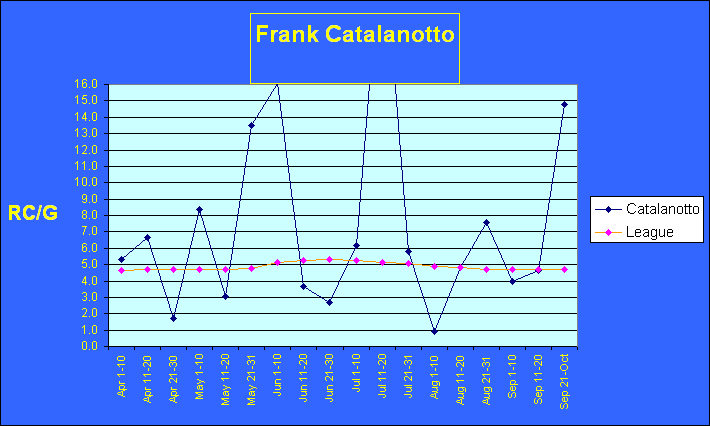
Frank Catalanotto isn't Manny Ramirez, but there are 12 other teams besides Toronto who don't have Manny Ramirez. He's one of a kind, and once more this year he was being Manny. The rest of us have to get by without him somehow. As for Catalanotto, he was healthy in 2005, and had a solid season (and an absolutely mind-boggling final week). In addition, Reed Johnson hit much, much better when he was in LF (.289) than when he was in RF (.225). The Toronto left fielders were awful in 2004, but they were clearly respectable this past season.
CENTRE FIELD
TEAM	    AB   R   H  TB 2B 3B HR RBI  BB  SO SB CS SH SF HBP GDP  AVG  SLG  OBP  RC RC/27
Boston     695 128 220 310 39  6 13  83  57  78 20  1  0  9   4   5 .317 .446 .367 117 6.64
Cleveland  675 115 194 323 38 11 23  83  54 139 23 10  6  2   7  17 .287 .479 .343 104 5.83
KC         641  95 180 272 41  6 14  65  56 111  6  7  7  7  13  12 .281 .424 .344  90 5.26
Toronto	   647  80 174 295 31  3 28  98  53  96  9  3  0  8   3  16 .269 .456 .323  90 5.15
Minnesota  631 100 169 267 35  3 19  80  52 109 32 10  1  4  12  17 .268 .423 .333  84 4.92
Chicago    621  81 173 260 32  5 15  73  35 121 20  6  7  4  20  19 .279 .419 .332  82 4.92
AVERAGE	   627  87 168 255 33  5 15  72  49 103 18  7  4  5   6  13 .268 .407 .322  79 4.64
Oakland	   685  88 185 289 37  2 21 101  44  69  5  6  1  5   1  15 .270 .422 .313  84 4.52
LA Angels  625  82 161 246 31  3 16  67  57  94 27 17  5  4   3   8 .258 .394 .318  75 4.35
Detroit	   555  69 144 218 24  7 12  51  38 104 25  7 14  5   2  11 .259 .393 .300  65 4.28
Tampa Bay  592  78 156 232 30  4 13  67  31 112 29  6  5  2   4  13 .264 .392 .301  68 4.21
Baltimore  571  75 149 198 27  2  6  52  43  92 23 12  6  6  10   5 .261 .347 .318  63 4.03
Texas      623  85 150 249 32  8 17  73  53 121 11  2  1  5   0  15 .241 .400 .298  70 4.02
Seattle	   599  68 148 204 36  4  4  52  57  92 16 11  4  4   2  12 .247 .341 .311  60 3.58
New York   622  68 151 207 31  2  7  60  50  99  6  4  3  8   1  16 .243 .333 .295  57 3.29
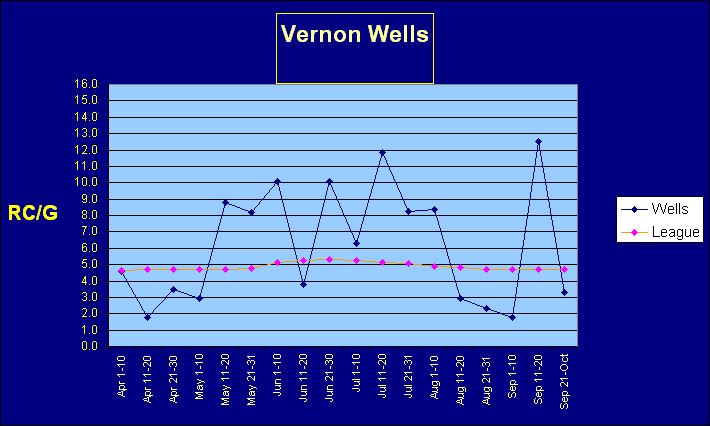
Many Blue Jays fans were disappointed by Vernon Wells 2005 season. Vernon Wells himself was very unhappy with his performance, and bviously what he did this past year doesn't compare to his 2003 campaign. True enough, but he was able to stay in the lineup and give the team superior offensive production at a key defensive position. I've said it many times already - he's a somewhat better version of Joe Carter as a hitter. The fact that he's also a Gold Glove centre fielder... seriously, what's not to like? See the player for what he is, not what someone thinks he ought to be. Among other things, Wells and Sizemore are the only AL centre fielders who can really be regarded as capable power hitters. Elsewhere - what can we say besides "Where have you gone, Joe DiMaggio? "Can't blame it on Womack, who had just 64 ABs as a CF. Williams was bad, and Matsui didn't hit when he was in CF. The Royals did surprisingly well without Carlos Beltran - David DeJesus had a productive year, and Aaron Guiel was very good indeed towards the end.
RIGHT FIELD
TEAM	    AB   R   H  TB 2B 3B HR RBI  BB  SO SB CS SH SF HBP GDP  AVG  SLG  OBP  RC RC/27
LA Angels  622 110 195 331 33  4 35 122  64  60 17  5  3  5   8  18 .314 .532 .380 120 7.56
New York   625 105 174 299 27  1 32 117  76  84 11  2  0  6   9  11 .278 .478 .362 106 6.33
KC	   603  86 172 281 38  4 21  98  53 113 10  2  2  7   7  16 .285 .466 .345  93 5.80
Chicago	   615  83 168 311 34  2 35 100  43 112 11  5  2  2   9  15 .273 .506 .328  95 5.74
Seattle    682 110 202 290 21 11 15  65  49  67 33  8  2  6   4   5 .296 .425 .343 101 5.70
Tampa Bay  624  86 175 281 25  6 24  83  50 119 12  8  2  6   9  10 .280 .450 .339  91 5.48
Oakland	   596  86 158 276 38  1 26  94  59 129  2  1  1  2   5  13 .265 .463 .335  87 5.39
Boston	   594  92 163 256 43  1 16  89  61  85  2  2  1  9   4  10 .274 .431 .341  85 5.31
AVERAGE	   615  89 167 278 32  4 24  89  54 106 10  4  1  5   7  13 .272 .451 .333  88 5.30
Baltimore  619  71 167 295 35  3 29  89  37 107  3  0  1  2   5  19 .270 .477 .315  85 5.10
Detroit	   620  73 172 255 29  3 16  87  54  90  4  2  0 13   3  14 .277 .411 .332  81 4.91
Minnesota  606  75 153 258 28  4 23  81  58 131 13  6  2  5   7  19 .252 .426 .322  76 4.56
Cleveland  586  80 138 247 36  2 23  61  55 133  3  6  2  5  10   9 .235 .422 .309  72 4.34
Texas      597  93 140 258 25  0 31  88  56 125  5  4  0  3   5  12 .235 .432 .304  73 4.34
Toronto	   625  91 163 248 29 10 12  76  35 133 14 11  0  4   9  14 .261 .397 .308  70 4.07
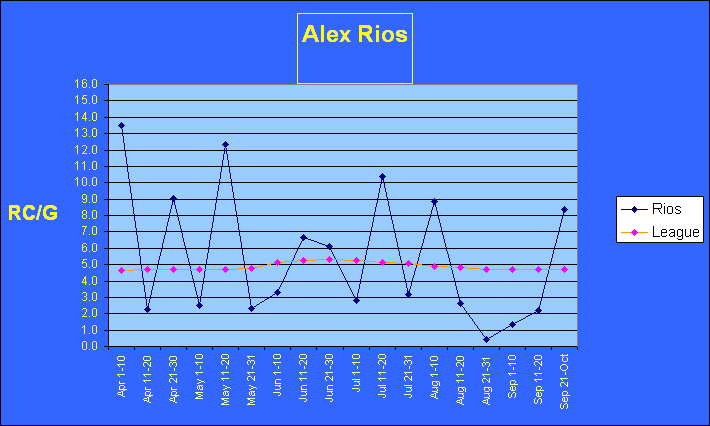
Ouch. This was not good at all. Alex Rios hit 10 times as many HRs as did in his rookie year, but he lost 20 points in batting average. He's been streaky as hell, going up and down like a yoyo until a month-long stretch towards the end of the season when he was consistently awful. Meanwhile, Reed Johnson didn't hit a lick when he was in right field. It all added up to regression. You know, Gabe Gross may yet have a future with this team...
DH
TEAM	   AB   R   H  TB 2B 3B HR RBI  BB  SO SB CS SH SF HBP GDP  AVG  SLG  OBP  RC RC/27
Boston    580 115 171 344 40  1 44 146 102 123  1  0  0  9   1  13 .295 .593 .396 132 8.70
Cleveland 573 102 167 323 45  0 37 115  83 146  0  0  0  4   9   9 .291 .564 .387 122 8.08
Detroit	  535  80 163 287 37  3 27  83  39 138  1  1  0  1   7  12 .305 .536 .359  97 7.04
Tampa Bay 558  80 148 258 38  3 22  94  56 138 11  4  1 10  15  16 .265 .462 .342  84 5.52
KC        552  78 146 249 36  2 21  82  69 103  2  1  1  8   4  15 .264 .451 .345  82 5.43
AVERAGE	  566  81 148 252 30  2 23  88  64 118  4  2  1  5   6  15 .261 .445 .339  80 5.19
Toronto	  551  82 150 238 44  4 12  64  49 110  2  3  3  3  16  15 .272 .432 .346  77 5.17
New York  574  78 141 247 19  0 29 108  85 114  0  1  0  4  11  15 .246 .430 .352  82 5.09
Chicago   579  75 141 268 25  2 33 107  56 122  4  5  0 12   5  13 .244 .463 .310  78 4.81
Texas	  579  97 141 247 20  4 26  69  71 151  4  3  1  3   5  17 .244 .427 .329  75 4.63
Minnesota 575  67 146 225 18  5 17  73  59 123  6  1  1  3   8   9 .254 .391 .330  72 4.55
Seattle	  572  71 153 221 22  2 14  80  56  95  7  1  2  3   2  13 .267 .386 .332  71 4.54
LA Angels 574  75 147 219 26  2 14  66  53  99 15  5  4  6   1  20 .256 .382 .315  64 4.05
Oakland	  567  69 139 199 23  2 11  71  62  84  1  0  3  1   3  21 .245 .351 .321  58 3.66
Baltimore 559  62 117 202 27  2 18  70  54 101  2  3  1  6   0  22 .209 .361 .276  49 2.97
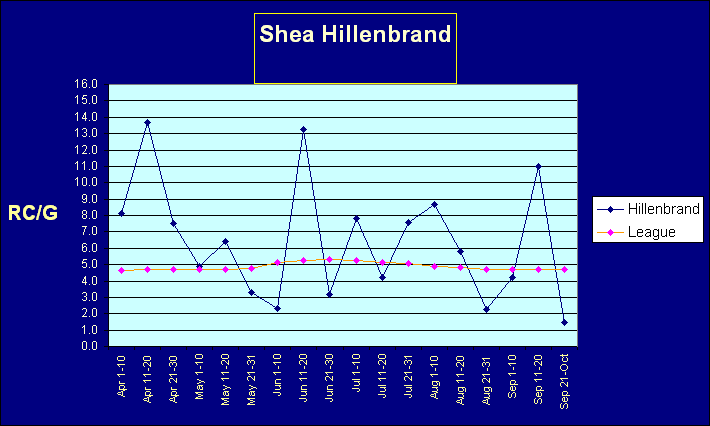
Yes, the Baltimore DHs were really that bad - they mainly shuffled Gibbons, Sosa, and Lopez through the spot - all three hit much better when they were also playing the field. Toronto DHs were awful in 2004, but this is the easiest position of all to find someone who can help. The Jays didn't have a regular DH - three men (Hillenbrand, Hill, and Hinske) had between 104 and 128 at bats. Two of the three were pretty good - Shea Hillenbrand early, and Eric Hinske late. Hinske was actually the best DH on the team (.308, .400, .442), by a nose over Hillenbrand. Hill was OK - the guys dragging down the numbers were Frank Menechino and, especially, Corey Koskie. Koskie went 11-69 (.159) as the DH. And so a lesson is learned: if Koskie needs a day off, you might as well just give him the day off.
The obvious places where Toronto urgently needs to upgrade are right field. And backup catcher - the Jays secondary catchers were awful, and Zaun pretty clearly wore down because there was no useful alternative. Granted, there's room for improvement pretty much everywhere - but those two spots were the real glaring problem areas in 2005.
I suppose we knew that already?
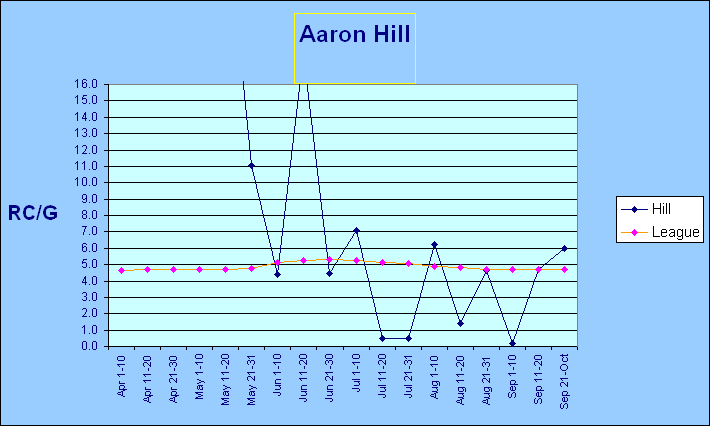
Our bonus graphic is Aaron Hill's rookie season:

Hill wasn't expected to arrive in the majors as soon as he did, and many of us were surprised when he was summoned after Koskie's injury. The Paul Molitor impression Hill performed for the AL during his first month in the big leagues has resulted in his being cut an awful lot of slack, both by people connected with the team as well as the fan base (as represented by you, gentle readers!) So it's my grim duty to remind you that the first nine guys I made pretty pictures for were all - every one of them, even Alex Rios - more productive hitters than Aaron Hill in 2005.
Think of Rios one year ago - that's where Hill is now. His first year showed off a pretty decent batting average, and pretty well nothing else. He's got some work to do, and Toronto fans will be hoping that he makes more progress in 2006 than Rios did in 2005.
But there are no guarantees.
https://www.battersbox.ca/article.php?story=20051007021812859